Translate

Monday, February 27, 2017

US Dollar Trade for March 2017 (Maybe Longer)

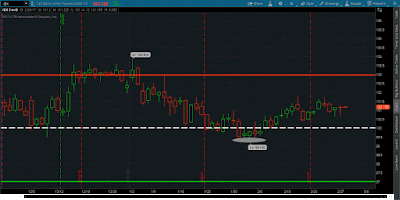
As an update to the February 2017 US dollar trade (maybe longer), I have expanded on the chart. The past month trading currencies has not been as consistent as the previous couple of months. My trading has been froth with conflicting feedback and false signals from my charts, and further hindered by the rigidity of my choice in trading approaches for this particular market environment.


I have highlighted (with the silver disc) the level I recommended selling the US dollar in my last post. The subsequent price action was higher, invalidating the trade, but not the trade idea.

From current level I recommend buying the US dollar with an exit target of 103 on the index. From there I expect the price to retrace back to the 100 level (highlighted by the dashed line), and then on to the 97 level on the index. At the 97 level on the dollar index, I expect the price to consolidate before moving higher back to the 100 level on the index and then on to the 103 level.

As it currently stands, there appears to be a +/- 3.00 point band around the 100 level on the US dollar index. This represents the range of uncertainty market participants anticipate about the future trajectory of the US dollar versus the currencies of its major trading partners. Good luck.


Tuesday, January 31, 2017

US Dollar Trade for February 2017 (Maybe Longer)

I have been long the dollar for the past several months, and it has been a trade. On the way up, I used the 100 level on the dollar index as both a target level for the initial run-up, and as a support level for the second leg of the trade.

Well its official folks, I'm calling the (temporary) end to the long dollar trade. I say temporary because there are some longer-term macro fundamentals that are at work, that will over time provide support to the US dollar versus its major trade counterparts. But for now, it seems that the most influential factor in determining the direction of the US dollar, and by extent the world economy is Donald Trump.


My trade idea is to short the US dollar from current levels, with a target of 97.0 for the index. From that level I expect sideways movement in the dollar with a relatively wide range. Representing a band of uncertainty outside of which a clear direction can be discerned. Good luck.


Saturday, November 5, 2016

Dollar Index Trade for November 2016 (maybe longer)

Despite (or because of) the uncertainty, and on some levels, unease that hangs over global financial markets and in particular the US financial market at the moment, the Dollar Index fundamentally is a buy. Factoring in the relative glide path of monetary policy in the US versus those of other developed economies, interest rate parity theory suggests further dollar appreciation. Or, if the news narrative further perpetuates the market uncertainty, investors will seek out the relative safety of the US dollar and US dollar denominated assets. Either way, the sell-offs in the dollar can be used to get better price positioning, though increases should be marginal as the price momentum is currently short.


Buy US dollar exposure at current levels through futures contracts on the index, or through futures and spot contracts on exchange rates of major financial trading partners of the United States. The profit target for the trade is an index level of 100.

Saturday, October 22, 2016

A New Home for Government Bond Investors

With the current monetary policy stance of the Federal Reserve System, and the tone being conveyed by the Fed's forward guidance, and market expectations for the path of monetary policy normalization in the United States, the exodus out of US government debt has begun. Net selling of bonds by investors tends to increase the market interest rate associated with the bond, which is in-line with the overall direction on monetary policy in the US. In anticipation of this, some investors adjust their portfolio allocations to reflect the expected downside to bond prices.

For those investors however, that must maintain their allocated levels of different asset classes, the expected downside for US government bonds means they need to find somewhere else to park their investment capital. An ideal candidate is Japanese Government Bonds (JGBs). Conceptually, the same reason why there will inevitably be a capital outflow from US government, is the reason why there will inevitably be a capital inflow into Japanese government debt.

Interest rates and bond prices move in opposite directions, therefore, the Fed raising interest rates will depress the prices of US government bonds, meanwhile, the Bank of Japan is firmly committed to Quantitative Easing and has no plans to raise interest rates any time soon. This monetary policy stance by the Central Bank supports the prices of Japanese government bonds, as these bonds are used as collateral for cheap money from the Central Bank. As an added bonus, the long-term deflationary trend of the Japanese economy means the future cash flow from the government bonds should have more purchasing power than the cash used to purchase the bonds. This should supplement the low nominal yield earned on the bonds.

Friday, September 30, 2016

S&P500 Trade for October 2016 (maybe longer)

From a purely technical viewpoint, the S&P500 can be sold at current levels (2,145) down to a target of 2,100. At that level I expect the market to then trade sideways while institutional traders consolidate their positions before the US equities market takes another step down to its next consolidation level.


Equity market sentiment can be expected to be bearish in the short term, therefore traders can look to sell holdings into price rallies while investors can look to increase holdings on price drops.

Happy trading.

Thursday, September 15, 2016

Is The Fed Stuck in a Liquidity Trap?

When both stocks and bonds are overpriced, and commodities which were considered overpriced less than five years ago and are now well on the way to correcting, where can an investor turn? It's sort of a trick question, because the answer is cash. Well enough, the Fed and most other major central banks are maintaining very accommodative monetary policy stances, providing ample dollar supplies to match the growing secular demand for liquidity. Institutional money inspired by the Fed Quantitative Easing (QE) programs has inflated and benefitted from the inflation of both stock and bond prices.

Now that the Fed's Large Scale Asset Purchase (LSAP) programs have ended, and the road to alleged monetary policy normalization has been embarked upon, the institutional investors no longer see the need for broad-based accumulation of financial assets. With no buyer-of-last resort, financial market participants (on the institutional level) will have to go back to relying on market demand to support the prices of the assets they buy and sell daily. This phenomenon is apparent in the mid-term price patterns of the S&P500, and the Dollar Index, which have both been advancing higher. Especially when compared to the price patterns of crude oil, gold, and the US 10-year interest rate, which have all been retrogressing.

According to a 2014 issue of The Regional Economist, by the St. Louis Fed, the article titled "The Liquidity Trap: An Alternative Explanation of Today's Low Inflation", states ...Conventionally, the expansion of the money supply will generate inflation as more money is chasing after the same amount of goods available. During a liquidity trap, however, increases in the money supply are fully absorbed by excess demand for money (liquidity) investors hoard the increased money instead of spending it because the opportunity cost of holding cash --the foregone earnings from interest-- is zero when the nominal interest rate is zero. Even worse, if the increased money supply is through LSAPs on long-term debt (as is the case under QE), investors are prompted to further shift their portfolio holdings from interest-bearing assets to cash.

To get away from this scenario, which sounds a lot like the one the US economy is in now, the article prescribes that the Federal Reserve attempt to raise inflation expectations by manipulating long-term interest rates. The idea is to not just stop the LSAPs and let the securities mature on the Fed's balance sheet, but rather to reverse the LSAPs and sell securities in the open market. A direct result would be financial asset prices falling as the market would seek to clear the increase in supply. This would push long-term interest rates higher, and theoretically lift long-term inflation expectations, which would in turn drag short-term inflation up with it. A downward trend in financial asset prices should prompt investors to shift portfolio holdings towards real and commodity based asset classes, pushing those prices higher, and further perpetuating short-term price increases.

The logic appears to be direct, so much so that it's a wonder that the Federal Reserve has not yet adopted and started implementing a similar policy. The issue may simply be that the real world does not flow as seamlessly as the theoretical world of financial economics, meaning the disconnect can represent years of waiting for sticky prices to adjust to economic fundamentals and for new market equilibria to be achieved. Pivots in monetary policy can be very disruptive to macroeconomics, which is why fiscal policy should be introduced to smooth out economic readjustments. This mix of monetary policy and fiscal policy can only be utilized effectively however, if there are no major budgeting constraints on the fiscal side, i.e. too much existing debt.

Thursday, September 1, 2016

Gold Trade for September 2016 (maybe longer)

As another proxy for financial market participants' expectation of general price inflation, gold as of recent has been expressing signs of weakness and downward pressure. In the longer term, gold has resisted the market forces that have been pushing crude oil lower, but trading opportunities still present themselves ever so often.


The preceding chart outlines the last three months of Gold prices. The timeframe for the trade is one month. Sell gold at its current levels ($1310) down to $1245, represented by the green line.

Happy trading.