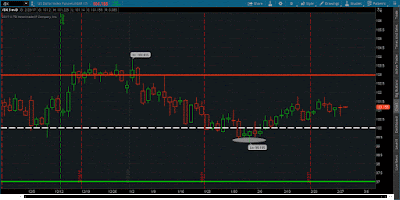
I have highlighted (with the silver disc) the level I recommended selling the US dollar in my last post. The subsequent price action was higher, invalidating the trade, but not the trade idea.
From current level I recommend buying the US dollar with an exit target of 103 on the index. From there I expect the price to retrace back to the 100 level (highlighted by the dashed line), and then on to the 97 level on the index. At the 97 level on the dollar index, I expect the price to consolidate before moving higher back to the 100 level on the index and then on to the 103 level.
As it currently stands, there appears to be a +/- 3.00 point band around the 100 level on the US dollar index. This represents the range of uncertainty market participants anticipate about the future trajectory of the US dollar versus the currencies of its major trading partners. Good luck.

