For all future blog posts please visit www.ijsblog.info. Thank you.
-IJS

Tuesday, May 8, 2018
Friday, May 4, 2018
When Standards No Longer Apply
Way back in the day when I was first learning about inflation and where it comes from, the distinction that was highlighted was between core and headline inflation. I came to understand that headline inflation is driven primarily by relatively more volatile food and especially energy prices. I also came to understand that core inflation is driven by relatively less volatile wages and housing costs. Fundamentally very straightforward concepts, but time and technology has a way of shifting the sand under the feet of even the most fundamentally straightforward concepts. Prime example being the Taylor Rule, but that's another discussion for another day.
When reading the April 2018 edition of the Federal Reserve Bank of San Francisco's FedViews, I came across a chart that highlighted a nuanced distinction between the correlation between wages and inflation pre 1985 which had a factor of 0.946 versus post 1985 which has a factor of 0.289. The composition of inflation measures did not change from before 1985 compared to after 1985, so that leaves the determinates of wage growth. The period stretching from the late 1970s to the early 1990s was plagued by a combination of high unemployment and high inflation, otherwise known as stagflation. The macroeconomic shift that was occurring during that period was the death of the manufacturing industry and the simultaneous emergence of the service industry as the dominant sector in the American economy.
The Fed also began actively targeting inflation levels towards the end of the 1980s in response to the stagflation during the period. The thing that threw off the balance was the shift in the US economic base from manufacturing to services. Inflation metrics were based on baskets of manufactured goods even though labor trends and by extent inflationary pressures began/are leaning towards the services sector. Services typically require relatively less labor and productivity can be enhanced with capital investments in technology. This simply means that the cost of new technology has a higher weighting than the cost of labor in determining the final cost of providing a service.
Unfortunately for workers in service-based economies, technology tends to evolve exponentially while costs tend to fall in a linear fashion. The exponential growth in technological efficiency means more workers are being displaced everyday than the day before, while the linear drop in cost means overall cost-of-living is falling relatively slower than real incomes. In other words, the skillset of the typical American worker is becoming obsolete; their bargaining power for wages is diminishing while consumer prices are being driven by factors outside the purview of the labor pool, with the shortfall being covered by personal debt.
The world has evolved and unfortunately not everyone has been willing or able to evolve with it, specifically the Baby Boomer generation. Fortunately, the millennial generation was born and raised in times of uncertainty and constant change, so we are native to creative destruction and rebirth. This is what the world looks like when standards no longer apply. We've got it from here.
Thursday, April 19, 2018
FIFO Monetary Policy and the Business Cycle
With all the talk of Yield Curve flattening and recession forecasting in the U.S., see U.S. Yield Curve and Risk of a Liquidity Trap ; it occurred to me to consider the interest rate structure of other developed economies and also juxtapose the economic narratives. Developed economies are generally experiencing low unemployment rates paired with low wage growth, healthy housing markets paired with available credit, and overpriced equity markets paired with geo-political uncertainty.
The common theme of shrinking spreads between long-term interest rates and short-term interest rates suggests that many developed economies are on similar positions on their business cycle. It stands to reason as Central Banks synchronized their response to the Great Recession, and monetary policy accommodation during the recovery and expansion stages of the business cycle. When the Federal Reserve embarked on its current monetary policy tightening cycle, they all but ensured that the U.S. economy would once again lead the world economy into its next recessionary cycle and out the other side.
By tightening monetary policy, which is inherently short-term, the Federal Reserve is accelerating the pace of yield curve flattening. As they drain liquidity from financial markets by selling short-term bonds, the Fed pushes up short-term interest rates. The loss of liquidity means less money is available to keep pushing up the price of equities so stock markets fall too. And finally, as stock prices fall investors buy long-term bonds for safety, pushing prices up and long-term interest rates down. This shift represents a change in market participants expectations about the trend in economic growth over the duration of the yield curve. Long-term rates falling relative to short-term rates is interpreted as future growth is expected to fall.
Central Bank policy and crisis response is generally backward-looking, so they only respond to recession after it is underway even if they are the technical cause. That being said, the first economy to go into a recession will have its Central Bank modify policy, and will be the first to cycle out of recession and onto recovery and expansion. First In First Out (FIFO).
Friday, April 6, 2018
Baby Boomers + Labor Market = Low Wage Growth
The one thing that has been consistently missing from this otherwise textbook recovery that was engineered by the US Federal Reserve is sustained wage growth. The one thing that has been consistently ignored in the narrative of the recovery has been labor force participation. The trend has been one of declining participation ratios, and this can only be expected to accelerate. The acceleration in the rate of decline of labor force participation is predominantly driven by the Baby-boomer exit from the labor market.
In terms of a lack of sustained growth in real wages in the last almost two decades, again the burden lies with the Baby-boomers. Wages grew while the Baby-boomers entered and matured in the workforce, including the macro-introduction of women into the labor market. Now we are at a point where Baby-boomer wages have increased for decades and now on aggregate are at their caps. Paired with Fed-backed low inflation expectations, employers on average have no reason to increase wages. However, as the Baby-boomer retirement trend accelerates, and their share of the labor pool shrinks, employers would have to increase wages on aggregate to keep or attract younger talent.
All-in-all things seem to work themselves out. Millennials get to experience sustained wage growth over some period congruent with experience and education, and long-term employers see their average wages fall as the boomers retire. Now let's take this slice of relative tranquility on the labor side of the Fed Mandate and overlay it with the pricing side of that same mandate.
The unwind of the Fed's Quantitative Easing policy and effective tightening of monetary policy, along with similar positions being adopted by other Central Banks means financial and other inflation sensitive assets will continue to reprice lower. Simultaneously, President Donald Trump is pursuing a trade policy that in one way or another will lead to higher consumer prices in the U.S. through higher import prices. U.S. households look to be caught in a full pincer maneuver. From one side they will be hit with falling financial asset prices which reduces the value of their savings, from the other side they will be hit by increasing consumer prices stemming from trade disputes, and finally from above with demographic pressures keeping wage growth subdued.
Long story short, when U.S. discretionary spending starts contracting a recession will soon follow.
Thursday, March 29, 2018
Ricardian Trade Theory and U.S. Total Factor Productivity
Total Factor Productivity which is defined as the economy-wide effects of innovation indirectly as the residual part of productivity growth that cannot be explained by other factors. Basically, the extra bit of efficiency that accumulates in an economy when everybody is becoming more efficient. According to a February 2018 Federal Reserve Bank of San Francisco Economic Letter titled, "The Disappointing Recovery in U.S. Output after 2009", quarterly growth in Total Factor Productivity is beginning to slowdown. The Economic Letter also highlights that the slowdown began before the Great Recession and coincided with a peak in labor force participation.
What the analysis featured in the Economic Letter ignores is the fact that the U.S. economy has not been growing its Total Factor Productivity in a vacuum. When the U.S. economy began reaping the benefits of the shift from a manufacturing base to a services base by the early 1990s, Total Factor Productivity increases manifested. Being a high capital economy, able to take advantage of economies-of-scale, the U.S. economy had a comparative advantage over its trading partners in services. The advantage compounded through the 1990s and culminated with the bursting of the dot-com bubble. During the formation and inflation of the dot-com bubble the U.S. dollar appreciated as foreign investment capital flooded in and the U.S. grew the capital account surplus.
By the turn of the millennium, labor force participation was peaking as the baby boomers began their exit from the labor market. Within five years the slowdown in Total Factor Production became apparent, just in time for the Great Recession. But after pressing its advantage in services from about 1985 to about 2005, the U.S. economy began experiencing diminishing returns. Data moves more freely around the world now more than ever before and has been doing this for decades. Simply put, other countries have the internet now. Open trade has allowed other countries to buy, learn from, and develop upon U.S. services and technologies. They too can grow their Total Factor Productivities. The good news is if we keep trading with countries that are getting more and more efficient, it will keep import prices low which benefits consumers.
Friday, March 23, 2018
U.S. Yield Curve and Risk of a Liquidity Trap
The Fed, after its most recent meeting reiterated its plans for the front end of the yield curve for the remainder of the year and into next year. Barring some unforeseen disaster in one form of another, of course. Market participants can expect at most three interest rate increases this year. Since the unwind of Quantitative Easing began, the Fed has been loosening its grip on the longer end of the curve, which has allowed for a clearer dissemination of market expectations through pricing data. My regression analysis of the last year's price of the 10-Year U.S. Treasury Note Futures, suggests a period of stable to rising prices in the medium-term. Stable to rising prices for 10-Year U.S. Treasuries means stable to falling interest rates for that segment of the yield curve. Pair that with the raising interest rates on the very front end of the curve, the trend of yield curve flattening that has been unfolding in bond markets is set to accelerate.
When the Fed raises short-term interest rates in a healthy economy, with growth on its horizon represented by a steepening yield curve, the rate increase transmits throughout the entire curve and pushes down all bond prices. In normal financial markets, investment capital would flow out of bonds and into stocks, raising equity prices and further reflecting expected economic growth. Apparently, we don't have a healthy economy, with growth on its horizon, or normal financial markets. With the Quantitative Easing unwind well underway and the now-apparent fact that the U.S. economy cannot support equity prices at current levels on its own, stock markets around the world are revaluing. Now for a bit of normalcy, falling stock prices will result in investment capital flowing into bonds. More specifically, the 10-Year U.S. Treasury Note for its perceived safety and liquidity, which will push the price up and interest rates down.
As the Fed continues along its intended course of interest rate increases, inflation expectations of market participants and businesses will continue to remain subdued. This translates into lower prices of inflation hedges like gold, and even lower input costs starting with oil. From the position of businesses, even with shortages of qualified labor, they don't have enough of an incentive to raise wages because they don't anticipate significate or continuous price increases in the near future.
My expectation is that as losses mount in U.S. equity markets, investors will have to liquidate foreign holdings, putting continued pressure on global equity markets, both developed and developing. In addition to liquidating foreign holdings, U.S. investors will repatriate cash to cover margin calls and rebalance leverage ratios by selling foreign currencies and buying U.S. Dollars. Dollar inflows will become exacerbated if the selling in equity markets accelerates and triggers a flight-to-safety reaction in market participants. In this scenario, the Fed will be forced to divert the course of monetary policy. And, if as the flattening yield curve suggests, a slowdown in U.S. economic growth or even a recession is pending, then the Fed does not have very much room to maneuver before they're back to a Quantitative Easing policy. The real definition of a Liquidity Trap.
Thursday, December 28, 2017
What The US Dollar is Telling Me About the Global Business Cycle
As of December 28, 2017 the one-day, one-week, one-month, one-quarter, and one-year regression slopes of the Dollar Index are all negative. Looking further back, the five-year and ten-year regression slopes are positive, but this reflects the recovery from the Great Recession over the past decade. Because the one-year regression slope is the longest of the short-term measures that has turned negative, tells me that the almost decade long rally in the US dollar came to an end in 2017. The apparent reversal in the mid-term trend of the US dollar is a signal of a return to normalcy in global financial markets, and international capital flow.
When searching for context, I like to look at my longer-term
charts out to twenty-years. What stands out is the period from mid-2001 to
mid-2008, and the economic narrative of the day. From the early 1990s through to the early
2000s the US economy, and by extent the global economy was is a long-term expansionary
period. The growth that was experienced resulted from the US economy going
through the finally stages of transitioning from a manufacturing dominant
economy to a services dominant economy. A process which started in the late
1970s, and manifested as stagflation in the 1980s.
For the duration of the expansion during the 1990s, the US
dollar appreciated against wide baskets of it trading partners. This
appreciation reflected international investment capital flowing into the US to
participate in the tech bubble and the broader US equities market. By mid-2002
the Dollar Index was making lower lows in conjunction with lower highs, which
signaled the start of a downward trend. The trend in the dollar continued until
mid-2008, by which time global financial markets had become aware of an
underlying problem with the US financial system. During that same period, the
US consumer was left to do what they do best, which is borrow and spend, and
that they did. There was economic growth driven by appreciating housing prices
and deepening household debt, and even a recovery in the US equities markets
after the dot-com crash. The US dollar depreciated from 2002 through to 2008
for the same reason why it will depreciate from 2017 through to 2022 and maybe
into 2023.
There have been trillions of dollars in value created in US
equities since the lows of 2009. For the recovery part of the business cycle,
the US economy was the biggest and safest game in town, while the rest of the
world ‘sorted through their financial
affairs’. Now that we are in the expansion part of the business cycle, risk
appetite is returning to global financial markets. With (tepid) growth ensured
in the US, market participants can move their profits from the US equities
market into international markets to better leverage the synchronized expansion
we are currently experiencing around the world.
If global economies keep expanding in sync with each other,
monetary policy will remain on a path of tightening around the world. However,
consumer price inflation will not return in a synchronized manner, which means
US interest rates should rise relatively slower than world averages. This
should lead to further dollar depreciation in the face of further economic
expansion, which should continue to support the US equities market.
Thursday, November 23, 2017
US Housing Market
For at least a decade leading up to the Great Recession multi-family housing starts were trending with single-family housing starts (in rate-of-change not magnitude). The 2009-2010 recession and the protracted recovery coincided with a compositional shift in the US population by age. The baby boomers are transitioning out of the labor force and their demand for housing is reshaping the residential real estate market. By the end of 2014, multi-family housing starts had matched or by some measures surpassed its pre-crisis levels. The recovery in single-family housing starts on the other hand has been tepid.
In the years leading up to, and proceeding the Great Recession, baby boomer demand for multi-family housing remained fairly consistent. With this as a base to support the market, the post-recession increases in demand from millennials and the elderly was enough to spur the recovery in multi-family housing units. The shift in preferences away from single-family housing units towards multi-family units, which is being influenced by many factors, is incentivizing home builders to construct more units. At the core of the shift is housing preferences is the baby boomer generation transitioning from the workforce, and wanting less living space.
The home builders with the projects in the regions where baby boomers are migrating for the climate are positioned to immediately take advantage of the new trend. Next up are the builders who are securing land for new construction in those same regions. The good news is that the upward trend in multi-family housing starts, which is being supported predominantly by the demands of the baby boomer generation is in its nascent stage. This potential tailwind can support a selective real estate portfolio over the next decade.
Thursday, September 28, 2017
Lemonade (Limonada)
Puerto Rico just had its entire electrical infrastructure decimated by hurricane Maria. It is estimated that the entire island could be without power for up to six months. This being a conservative estimate, means realistically we're talking twelve to eighteen months. But, as the adage goes, 'When life gives you lemons, you make lemonade'. Or in this case limonada. Puerto Rico's electrical infrastructure needed improving and modernizing, but those types of projects to a backseat to the debt issues the US territory was entangled in with private institutional investors.
In the wake of the destruction inflicted by hurricane Maria across the island, the International Monetary Fund (IMF) can step in to help the people of Puerto Rico rebuild after this humanitarian disaster. The IMF will of course insist on some measure of fiscal austerity in exchange for the loan, which in all honesty the timing would be ideal {I'll explain later}. Puerto Rico would be able to build a completely modern electrical infrastructure system. A system with built-in safeguards against natural disasters, especially hurricanes as the strength of the storms positively correlate to the temperature of the oceans where they form. Whether it's from natural oscillations in ocean temperatures over the long-term, or human activity exaggerating natural oscillations in ocean temperature over the medium-term, ocean temperatures are trending higher.
As for the ideal timing of IMF imposed austerity measures, the best time to raise taxes while cutting government spending is when (almost) everyone has a job. On a slightly smaller, much more efficient model of how the Federal Emergency Management Agency (FEMA) allocates funds and reimburses businesses and local governments, Puerto Rico can tap large swathes of its labor pool. Puerto Ricans can be put to work modernizing Puerto Rico's electrical and information infrastructure. From manual labor, to administrative, to finance, to legal, there will be hundreds of thousands of roles that will need to be filled to make a project of this magnitude a success. The net effect on the national economy should be a jump-start in personal consumption from the fiscal stimulus being dampened by higher tax rates.
Hurricane Maria has presented Puerto Rico with an opportunity to make it-self more competitive in the long-term, more attractive to businesses that depend on frontier level information and logistic infrastructure to develop and commercialize new technologies and processes. Simultaneous investments in the education system will need to be made, or Puerto Rico risks having a local workforce not equipped to compete globally for local jobs.
Wednesday, August 2, 2017
Where Did the Inflation Trade Go?
Over the past month, Crude Oil, Gold, and the US 10-year Treasury have all been advancing higher. On the surface the feedback from the price action is conflicting. I'll start with higher oil prices, as I believe it is leading the group, indicating higher producer and consumer prices down the pipeline.

According to the December 2015 Dallas Fed Economic Letter titled, 'Cheaper Crude Oil Affects Consumer Prices Unevenly', the pass-through time for the non-energy components of the Personal Consumption Expenditures (PCE) Index can be severely delayed. The Economic Letter highlights that though non-energy categories make up 95-percent of the PCE weight, it can take up to six months for 50-percent of the long-run pass-through of price changes in oil to materialize. And more than two years for consumers to realize the complete price adjustment.
For purely technical reasons, I see the price of a barrel of crude oil advancing and remaining above $50. The fundamental rationale will become apparent in time. With this assumption as my anchor, I can turn my attention to Gold, and the US 10-year Treasury. With Crude Oil trending higher over the interim, I would expect the price of Gold to also reflect the sentiment, driven primarily by demand from inflation hedging. The US 10-year Treasury then seems to be the odd-man, as its value is eroded by both realized and expected increases in consumer prices.
The last month's higher prices for the US 10-year Treasury also contradicts the rationale of a fixed-income market that is facing dual headwinds of explicit monetary tightening through FOMC rate increases, and implicit monetary tightening through balance sheet reductions via asset roll-offs. I interpret this to mean the trend of buying that has become apparent in the US 10-year Treasury market in the past month will be relatively short-lived, as there are macro-economic fundamentals that are working to push that market in the opposite direction.
My context for the Inflation Trade is Crude Oil leading Gold higher, and the eventual return to a sell-off in the 10-year Treasury market, especially as the Fed stops re-investing proceeds from maturing instruments.
Thursday, May 18, 2017
US Labor Market Disconnect - Productivity vs Compensation
The US labor market has been at the center of economic debates since we all
realized that the Fed would not be able to generate positive inflation in line
with long run expectations through monetary interventions. With the official
unemployment rate at levels associated with full employment, one can reasonably
expect to see consistent upward pressure on wages. This is not the case
however. Basic reasoning would suggest that as workers become more and more
productive relative to hours worked, they would be compensated more, but again,
that’s not the case. Per Bureau of Labor Statistics data, since the Great
Recession the divergence between labor productivity and labor compensation has
been exacerbated.
The
productivity-compensation gap—defined as labor productivity divided by labor
compensation.

In the almost decade since the onset of the Great Recession,
the issue of compensation not keeping up with productivity has been becoming
more pronounced. Because so many workers got displaced during the Great
Recession many people had to completely re-tool themselves for the labor
market. With elevated levels of new entrants with limited levels of work-specific
experience, wage pressures turned negative. This trend in conjunction with a
rotation away from baby-boomers and towards millennials also means that
technological adoption and implementation has been set on an accelerated path.

The longer-term trend in labor compensation versus labor
productivity was one of tandem movement, until about the mid-70s. This period
reflects a macro shift away from manufacturing as the industrial base of the US
economy to a more services dominated base. The shift also means that corporate
productivity measures depend less and less on the input of labor, and more and
more on the input of technological innovation. The decade covering the late 70s
to the late 80s would have also been marked by large numbers of workers being
displaced and having to re-tool themselves for the new labor market.
Its seems like the adage “History repeats itself…” rings
true in this instance. Except for the caveat, that intrinsic problems in an
economy left unattended for thirty years will only get worst over time. This brings to mind one of the tenets of
finance, compounding does work.
Sunday, April 30, 2017
To Tax, or Not to Tax? Is That Really the Question?
When tax reform is discussed, it is usually in terms of who
gets a new tax cut and who loses a tax subsidy. This time around, individual
taxes are (sort of) on the table. Looked at from an isolationist viewpoint,
both individual and corporate taxes should be susceptible to increase or
decrease going into the negotiation, as the end-goal in any tax reform debate in
the US at this point, should be to increase revenue. But more realistically, in
a globalized world only one of the two tax bases are mobile.
With that guiding principle, an ideal tax reform proposal
should include both individual and corporate tax rates being realigned with the
times. No politician wants to stand on the platform of higher taxes, so maybe
America’s first non-politician president might want to give it a try. Point
blank, individual tax rates in this country need to go up. Yes, people will complain,
but the ones that use more of the services will be right here paying their
taxes. Corporate tax rates on the other hand need to be lowered to bring them
in line with other developed economies. The goal is to incentivize
multinational and international businesses to setup shop in the US. An ideal
outcome would be to see a reversal of the corporate tax inversion trend in the
US, and eventually to see foreign companies inverting to be domiciled in the
US.
The primary objective of corporate tax policy in the US is
to drive private sector spending of cash that would otherwise be held and/or
spent outside the country. To do this, companies need to be incentivized, and
the path of least resistance for spending and investing for large multinational
companies is the lowest tax rate jurisdiction. The potential for a net
shortfall in corporate tax revenue should be outweighed by the potential social
benefit of a sustained increase in both domestic and foreign corporate spending
within the United States. Paired with an increase in individual income tax
revenue, the social benefit from increased private sector spending should put
marginally less strain on the Federal government budget.
Of course, no conversation about US tax reform is complete
without at minimum a mention of entitlement spending. Lowing corporate tax
rates and even increasing individual tax rates short of draconian levels will
at best have a marginal effect on the overall fiscal position of the US Federal
government. Real, tangible efficacy does not come into play until you start
pairing net tax rate increases with decreases in entitlement spending. Not just
cosmetic cuts, but deep slashes in social security and medicare spending. The
burden will inevitably fall onto the states which would have to in-turn increase
tax rates to cover the additional costs of providing social safety nets.
Private sector spending in increasing productivity needs to
be met with a better educated, more flexible workforce. Which again the burden
falls on the Federal and state governments to bolster the education system.
There aren’t two ways about it, tax rates need to be increased in the United
States. Of tax rates in general, individual tax rates need to be increased on a
disproportionate scale to corporate tax rates, which need to be decreased to become
more competitive on a globalized stage. This is a tall order for even the most agile,
and well-versed politician, damn near impossible for someone relying on
on-the-job-training. On the other hand, maybe this is the one time in American
political history that the motives of a self-serving businessman align with
what is best for the country. After-all, despite being the richest person to
every run for President of the United States, Donald Trump managed to be most
relatable to some of the poorer parts of American society. Good luck Mr.
President.
Tuesday, April 11, 2017
New Equilibria
It's spring time and all the usual signs are there. The
weather, the people, the animals, but somehow this year feels different. The
efforts of previous years simply just do not yield as much as they once
did, and that's OK. This does not signify a need for retrenchment,
but rather a need for exploration and evolution. The way forward, should always
be forward. Globally, financial economics and the markets it studies are in a
state of uncertainty, and again, that's OK. This is a time for new equilibria
to be achieved, and in the process, there will inevitably be winners and there
will be losers. The social responsibility of any organized economic area is to
further the wellbeing of its inhabitants, this can especially be said for the
afore mentioned losers. In the current environment, long standing trends are
becoming more ambiguous, and this should be viewed as an opportunity. The
opportunity is finding intrinsic value within the cluttered noise of markets,
and market prices.
Monday, March 13, 2017
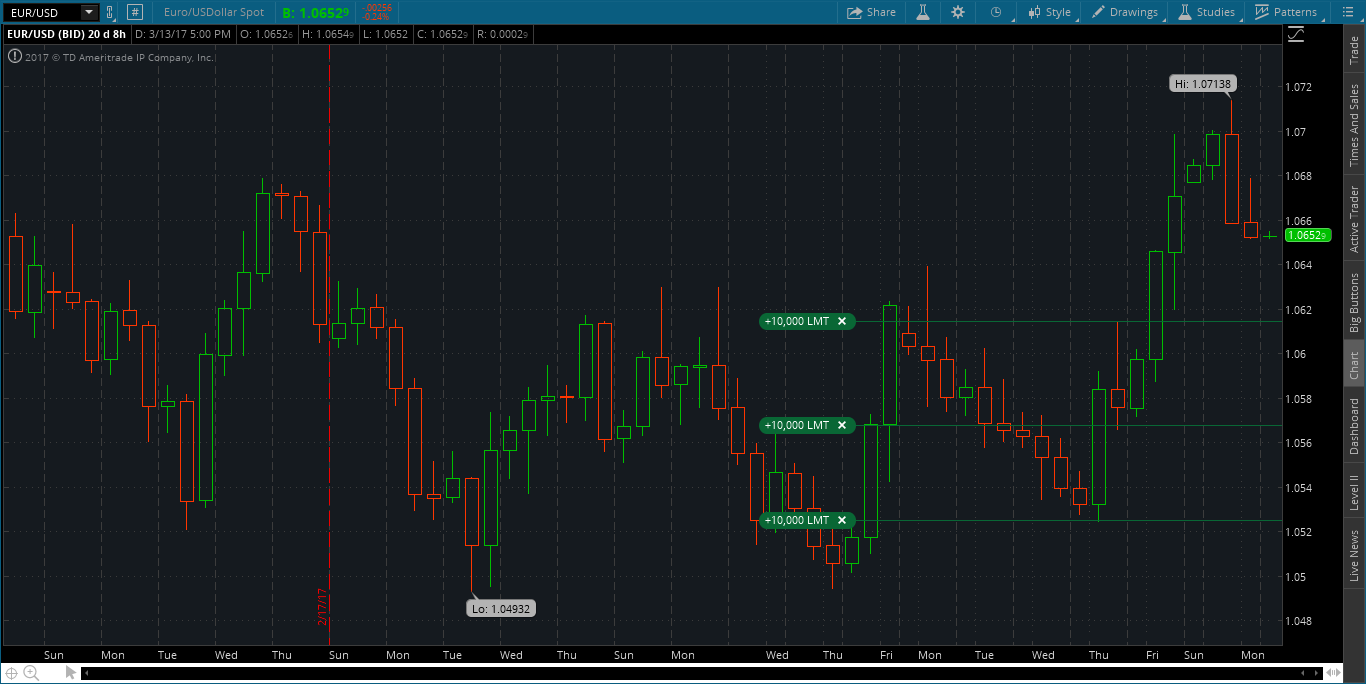
EUR/USD spot trade ahead of Wednesday's (03/15/17) Fed Decision
This is a short EURUSD position I opened ahead of the Fed Rate decision on Wednesday. I'm short 3 mini lots and my profit limits are represented in the chart.
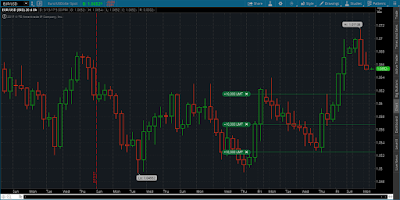
Good luck.
Monday, February 27, 2017
US Dollar Trade for March 2017 (Maybe Longer)
As an update to the February 2017 US dollar trade (maybe longer), I have expanded on the chart. The past month trading currencies has not been as consistent as the previous couple of months. My trading has been froth with conflicting feedback and false signals from my charts, and further hindered by the rigidity of my choice in trading approaches for this particular market environment.
I have highlighted (with the silver disc) the level I recommended selling the US dollar in my last post. The subsequent price action was higher, invalidating the trade, but not the trade idea.
From current level I recommend buying the US dollar with an exit target of 103 on the index. From there I expect the price to retrace back to the 100 level (highlighted by the dashed line), and then on to the 97 level on the index. At the 97 level on the dollar index, I expect the price to consolidate before moving higher back to the 100 level on the index and then on to the 103 level.
As it currently stands, there appears to be a +/- 3.00 point band around the 100 level on the US dollar index. This represents the range of uncertainty market participants anticipate about the future trajectory of the US dollar versus the currencies of its major trading partners. Good luck.
Tuesday, January 31, 2017
US Dollar Trade for February 2017 (Maybe Longer)
I have been long the dollar for the past several months, and it has been a trade. On the way up, I used the 100 level on the dollar index as both a target level for the initial run-up, and as a support level for the second leg of the trade.
Well its official folks, I'm calling the (temporary) end to the long dollar trade. I say temporary because there are some longer-term macro fundamentals that are at work, that will over time provide support to the US dollar versus its major trade counterparts. But for now, it seems that the most influential factor in determining the direction of the US dollar, and by extent the world economy is Donald Trump.

My trade idea is to short the US dollar from current levels, with a target of 97.0 for the index. From that level I expect sideways movement in the dollar with a relatively wide range. Representing a band of uncertainty outside of which a clear direction can be discerned. Good luck.
Saturday, November 5, 2016
Dollar Index Trade for November 2016 (maybe longer)
Despite (or because of) the uncertainty, and on some levels, unease that hangs over global financial markets and in particular the US financial market at the moment, the Dollar Index fundamentally is a buy. Factoring in the relative glide path of monetary policy in the US versus those of other developed economies, interest rate parity theory suggests further dollar appreciation. Or, if the news narrative further perpetuates the market uncertainty, investors will seek out the relative safety of the US dollar and US dollar denominated assets. Either way, the sell-offs in the dollar can be used to get better price positioning, though increases should be marginal as the price momentum is currently short.


Buy US dollar exposure at current levels through futures contracts on the index, or through futures and spot contracts on exchange rates of major financial trading partners of the United States. The profit target for the trade is an index level of 100.
Saturday, October 22, 2016
A New Home for Government Bond Investors
With the current monetary policy stance of the Federal Reserve System, and the tone being conveyed by the Fed's forward guidance, and market expectations for the path of monetary policy normalization in the United States, the exodus out of US government debt has begun. Net selling of bonds by investors tends to increase the market interest rate associated with the bond, which is in-line with the overall direction on monetary policy in the US. In anticipation of this, some investors adjust their portfolio allocations to reflect the expected downside to bond prices.
For those investors however, that must maintain their allocated levels of different asset classes, the expected downside for US government bonds means they need to find somewhere else to park their investment capital. An ideal candidate is Japanese Government Bonds (JGBs). Conceptually, the same reason why there will inevitably be a capital outflow from US government, is the reason why there will inevitably be a capital inflow into Japanese government debt.
Interest rates and bond prices move in opposite directions, therefore, the Fed raising interest rates will depress the prices of US government bonds, meanwhile, the Bank of Japan is firmly committed to Quantitative Easing and has no plans to raise interest rates any time soon. This monetary policy stance by the Central Bank supports the prices of Japanese government bonds, as these bonds are used as collateral for cheap money from the Central Bank. As an added bonus, the long-term deflationary trend of the Japanese economy means the future cash flow from the government bonds should have more purchasing power than the cash used to purchase the bonds. This should supplement the low nominal yield earned on the bonds.
Friday, September 30, 2016
S&P500 Trade for October 2016 (maybe longer)
From a purely technical viewpoint, the S&P500 can be sold at current levels (2,145) down to a target of 2,100. At that level I expect the market to then trade sideways while institutional traders consolidate their positions before the US equities market takes another step down to its next consolidation level.

Equity market sentiment can be expected to be bearish in the short term, therefore traders can look to sell holdings into price rallies while investors can look to increase holdings on price drops.
Happy trading.

Equity market sentiment can be expected to be bearish in the short term, therefore traders can look to sell holdings into price rallies while investors can look to increase holdings on price drops.
Happy trading.
Thursday, September 15, 2016
Is The Fed Stuck in a Liquidity Trap?
When both stocks and bonds are overpriced, and commodities which were considered overpriced less than five years ago and are now well on the way to correcting, where can an investor turn? It's sort of a trick question, because the answer is cash. Well enough, the Fed and most other major central banks are maintaining very accommodative monetary policy stances, providing ample dollar supplies to match the growing secular demand for liquidity. Institutional money inspired by the Fed Quantitative Easing (QE) programs has inflated and benefitted from the inflation of both stock and bond prices.
Now that the Fed's Large Scale Asset Purchase (LSAP) programs have ended, and the road to alleged monetary policy normalization has been embarked upon, the institutional investors no longer see the need for broad-based accumulation of financial assets. With no buyer-of-last resort, financial market participants (on the institutional level) will have to go back to relying on market demand to support the prices of the assets they buy and sell daily. This phenomenon is apparent in the mid-term price patterns of the S&P500, and the Dollar Index, which have both been advancing higher. Especially when compared to the price patterns of crude oil, gold, and the US 10-year interest rate, which have all been retrogressing.
According to a 2014 issue of The Regional Economist, by the St. Louis Fed, the article titled "The Liquidity Trap: An Alternative Explanation of Today's Low Inflation", states ...Conventionally, the expansion of the money supply will generate inflation as more money is chasing after the same amount of goods available. During a liquidity trap, however, increases in the money supply are fully absorbed by excess demand for money (liquidity) investors hoard the increased money instead of spending it because the opportunity cost of holding cash --the foregone earnings from interest-- is zero when the nominal interest rate is zero. Even worse, if the increased money supply is through LSAPs on long-term debt (as is the case under QE), investors are prompted to further shift their portfolio holdings from interest-bearing assets to cash.
To get away from this scenario, which sounds a lot like the one the US economy is in now, the article prescribes that the Federal Reserve attempt to raise inflation expectations by manipulating long-term interest rates. The idea is to not just stop the LSAPs and let the securities mature on the Fed's balance sheet, but rather to reverse the LSAPs and sell securities in the open market. A direct result would be financial asset prices falling as the market would seek to clear the increase in supply. This would push long-term interest rates higher, and theoretically lift long-term inflation expectations, which would in turn drag short-term inflation up with it. A downward trend in financial asset prices should prompt investors to shift portfolio holdings towards real and commodity based asset classes, pushing those prices higher, and further perpetuating short-term price increases.
The logic appears to be direct, so much so that it's a wonder that the Federal Reserve has not yet adopted and started implementing a similar policy. The issue may simply be that the real world does not flow as seamlessly as the theoretical world of financial economics, meaning the disconnect can represent years of waiting for sticky prices to adjust to economic fundamentals and for new market equilibria to be achieved. Pivots in monetary policy can be very disruptive to macroeconomics, which is why fiscal policy should be introduced to smooth out economic readjustments. This mix of monetary policy and fiscal policy can only be utilized effectively however, if there are no major budgeting constraints on the fiscal side, i.e. too much existing debt.
Subscribe to:
Posts (Atom)