Translate

Thursday, December 28, 2017

What The US Dollar is Telling Me About the Global Business Cycle


As of December 28, 2017 the one-day, one-week, one-month, one-quarter, and one-year regression slopes of the Dollar Index are all negative. Looking further back, the five-year and ten-year regression slopes are positive, but this reflects the recovery from the Great Recession over the past decade.  Because the one-year regression slope is the longest of the short-term measures that has turned negative, tells me that the almost decade long rally in the US dollar came to an end in 2017. The apparent reversal in the mid-term trend of the US dollar is a signal of a return to normalcy in global financial markets, and international capital flow.  


When searching for context, I like to look at my longer-term charts out to twenty-years. What stands out is the period from mid-2001 to mid-2008, and the economic narrative of the day.  From the early 1990s through to the early 2000s the US economy, and by extent the global economy was is a long-term expansionary period. The growth that was experienced resulted from the US economy going through the finally stages of transitioning from a manufacturing dominant economy to a services dominant economy. A process which started in the late 1970s, and manifested as stagflation in the 1980s.

For the duration of the expansion during the 1990s, the US dollar appreciated against wide baskets of it trading partners. This appreciation reflected international investment capital flowing into the US to participate in the tech bubble and the broader US equities market. By mid-2002 the Dollar Index was making lower lows in conjunction with lower highs, which signaled the start of a downward trend. The trend in the dollar continued until mid-2008, by which time global financial markets had become aware of an underlying problem with the US financial system. During that same period, the US consumer was left to do what they do best, which is borrow and spend, and that they did. There was economic growth driven by appreciating housing prices and deepening household debt, and even a recovery in the US equities markets after the dot-com crash. The US dollar depreciated from 2002 through to 2008 for the same reason why it will depreciate from 2017 through to 2022 and maybe into 2023.

There have been trillions of dollars in value created in US equities since the lows of 2009. For the recovery part of the business cycle, the US economy was the biggest and safest game in town, while the rest of the world ‘sorted through their financial affairs’. Now that we are in the expansion part of the business cycle, risk appetite is returning to global financial markets. With (tepid) growth ensured in the US, market participants can move their profits from the US equities market into international markets to better leverage the synchronized expansion we are currently experiencing around the world.

If global economies keep expanding in sync with each other, monetary policy will remain on a path of tightening around the world. However, consumer price inflation will not return in a synchronized manner, which means US interest rates should rise relatively slower than world averages. This should lead to further dollar depreciation in the face of further economic expansion, which should continue to support the US equities market.

Thursday, November 23, 2017

US Housing Market

For at least a decade leading up to the Great Recession multi-family housing starts were trending with single-family housing starts (in rate-of-change not magnitude). The 2009-2010 recession and the protracted recovery coincided with a compositional shift in the US population by age. The baby boomers are transitioning out of the labor force and their demand for housing is reshaping the residential real estate market. By the end of 2014, multi-family housing starts had matched or by some measures surpassed its pre-crisis levels. The recovery in single-family housing starts on the other hand has been tepid.

In the years leading up to, and proceeding the Great Recession, baby boomer demand for multi-family housing remained fairly consistent. With this as a base to support the market, the post-recession increases in demand from millennials and the elderly was enough to spur the recovery in multi-family housing units. The shift in preferences away from single-family housing units towards multi-family units, which is being influenced by many factors, is incentivizing home builders to construct more units. At the core of the shift is housing preferences is the baby boomer generation transitioning from the workforce, and wanting less living space.

The home builders with the projects in the regions where baby boomers are migrating for the climate are positioned to immediately take advantage of the new trend. Next up are the builders who are securing land for new construction in those same regions. The good news is that the upward trend in multi-family housing starts, which is being supported predominantly by the demands of the baby boomer generation is in its nascent stage. This potential tailwind can support a selective real estate portfolio over the next decade. 

Thursday, September 28, 2017

Lemonade (Limonada)

Puerto Rico just had its entire electrical infrastructure decimated by hurricane Maria. It is estimated that the entire island could be without power for up to six months. This being a conservative estimate, means realistically we're talking twelve to eighteen months. But, as the adage goes, 'When life gives you lemons, you make lemonade'. Or in this case limonada. Puerto Rico's electrical infrastructure needed improving and modernizing, but those types of projects to a backseat to the debt issues the US territory was entangled in with private institutional investors.

In the wake of the destruction inflicted by hurricane Maria across the island, the International Monetary Fund (IMF) can step in to help the people of Puerto Rico rebuild after this humanitarian disaster. The IMF will of course insist on some measure of fiscal austerity in exchange for the loan, which in all honesty the timing would be ideal {I'll explain later}. Puerto Rico would be able to build a completely modern electrical infrastructure system. A system with built-in safeguards against natural disasters, especially hurricanes as the strength of the storms positively correlate to the temperature of the oceans where they form. Whether it's from natural oscillations in ocean temperatures over the long-term, or human activity exaggerating natural oscillations in ocean temperature over the medium-term, ocean temperatures are trending higher.

As for the ideal timing of IMF imposed austerity measures, the best time to raise taxes while cutting government spending is when (almost) everyone has a job. On a slightly smaller, much more efficient model of how the Federal Emergency Management Agency (FEMA) allocates funds and reimburses businesses and local governments, Puerto Rico can tap large swathes of its labor pool. Puerto Ricans can be put to work modernizing Puerto Rico's electrical and information infrastructure. From manual labor, to administrative, to finance, to legal, there will be hundreds of thousands of roles that will need to be filled to make a project of this magnitude a success. The net effect on the national economy should be a jump-start in personal consumption from the fiscal stimulus being dampened by higher tax rates.

Hurricane Maria has presented Puerto Rico with an opportunity to make it-self more competitive in the long-term, more attractive to businesses that depend on frontier level information and logistic infrastructure to develop and commercialize new technologies and processes. Simultaneous investments in the education system will need to be made, or Puerto Rico risks having a local workforce not equipped to compete globally for local jobs.


Wednesday, August 2, 2017

Where Did the Inflation Trade Go?

Over the past month, Crude Oil, Gold, and the US 10-year Treasury have all been advancing higher. On the surface the feedback from the price action is conflicting. I'll start with higher oil prices, as I believe it is leading the group, indicating higher producer and consumer prices down the pipeline.


According to the December 2015 Dallas Fed Economic Letter titled, 'Cheaper Crude Oil Affects Consumer Prices Unevenly', the pass-through time for the non-energy components of the Personal Consumption Expenditures (PCE) Index can be severely delayed. The Economic Letter highlights that though non-energy categories make up 95-percent of the PCE weight, it can take up to six months for 50-percent of the long-run pass-through of price changes in oil to materialize. And more than two years for consumers to realize the complete price adjustment.

For purely technical reasons, I see the price of a barrel of crude oil advancing and remaining above $50. The fundamental rationale will become apparent in time. With this assumption as my anchor, I can turn my attention to Gold, and the US 10-year Treasury. With Crude Oil trending higher over the interim, I would expect the price of Gold to also reflect the sentiment, driven primarily by demand from inflation hedging. The US 10-year Treasury then seems to be the odd-man, as its value is eroded by both realized and expected increases in consumer prices.

The last month's higher prices for the US 10-year Treasury also contradicts the rationale of a fixed-income market that is facing dual headwinds of explicit monetary tightening through FOMC rate increases, and implicit monetary tightening through balance sheet reductions via asset roll-offs. I interpret this to mean the trend of buying that has become apparent in the US 10-year Treasury market in the past month will be relatively short-lived, as there are macro-economic fundamentals that are working to push that market in the opposite direction.

My context for the Inflation Trade is Crude Oil leading Gold higher, and the eventual return to a sell-off in the 10-year Treasury market, especially as the Fed stops re-investing proceeds from maturing instruments.

Thursday, May 18, 2017

US Labor Market Disconnect - Productivity vs Compensation


The US labor market has been at the center of economic debates since we all realized that the Fed would not be able to generate positive inflation in line with long run expectations through monetary interventions. With the official unemployment rate at levels associated with full employment, one can reasonably expect to see consistent upward pressure on wages. This is not the case however. Basic reasoning would suggest that as workers become more and more productive relative to hours worked, they would be compensated more, but again, that’s not the case. Per Bureau of Labor Statistics data, since the Great Recession the divergence between labor productivity and labor compensation has been exacerbated.

The productivity-compensation gap—defined as labor productivity divided by labor compensation.


In the almost decade since the onset of the Great Recession, the issue of compensation not keeping up with productivity has been becoming more pronounced. Because so many workers got displaced during the Great Recession many people had to completely re-tool themselves for the labor market. With elevated levels of new entrants with limited levels of work-specific experience, wage pressures turned negative. This trend in conjunction with a rotation away from baby-boomers and towards millennials also means that technological adoption and implementation has been set on an accelerated path. 


The longer-term trend in labor compensation versus labor productivity was one of tandem movement, until about the mid-70s. This period reflects a macro shift away from manufacturing as the industrial base of the US economy to a more services dominated base. The shift also means that corporate productivity measures depend less and less on the input of labor, and more and more on the input of technological innovation. The decade covering the late 70s to the late 80s would have also been marked by large numbers of workers being displaced and having to re-tool themselves for the new labor market.
Its seems like the adage “History repeats itself…” rings true in this instance. Except for the caveat, that intrinsic problems in an economy left unattended for thirty years will only get worst over time.  This brings to mind one of the tenets of finance, compounding does work.

Sunday, April 30, 2017

To Tax, or Not to Tax? Is That Really the Question?


When tax reform is discussed, it is usually in terms of who gets a new tax cut and who loses a tax subsidy. This time around, individual taxes are (sort of) on the table. Looked at from an isolationist viewpoint, both individual and corporate taxes should be susceptible to increase or decrease going into the negotiation, as the end-goal in any tax reform debate in the US at this point, should be to increase revenue. But more realistically, in a globalized world only one of the two tax bases are mobile.

With that guiding principle, an ideal tax reform proposal should include both individual and corporate tax rates being realigned with the times. No politician wants to stand on the platform of higher taxes, so maybe America’s first non-politician president might want to give it a try. Point blank, individual tax rates in this country need to go up. Yes, people will complain, but the ones that use more of the services will be right here paying their taxes. Corporate tax rates on the other hand need to be lowered to bring them in line with other developed economies. The goal is to incentivize multinational and international businesses to setup shop in the US. An ideal outcome would be to see a reversal of the corporate tax inversion trend in the US, and eventually to see foreign companies inverting to be domiciled in the US.

The primary objective of corporate tax policy in the US is to drive private sector spending of cash that would otherwise be held and/or spent outside the country. To do this, companies need to be incentivized, and the path of least resistance for spending and investing for large multinational companies is the lowest tax rate jurisdiction. The potential for a net shortfall in corporate tax revenue should be outweighed by the potential social benefit of a sustained increase in both domestic and foreign corporate spending within the United States. Paired with an increase in individual income tax revenue, the social benefit from increased private sector spending should put marginally less strain on the Federal government budget.

Of course, no conversation about US tax reform is complete without at minimum a mention of entitlement spending. Lowing corporate tax rates and even increasing individual tax rates short of draconian levels will at best have a marginal effect on the overall fiscal position of the US Federal government. Real, tangible efficacy does not come into play until you start pairing net tax rate increases with decreases in entitlement spending. Not just cosmetic cuts, but deep slashes in social security and medicare spending. The burden will inevitably fall onto the states which would have to in-turn increase tax rates to cover the additional costs of providing social safety nets.

Private sector spending in increasing productivity needs to be met with a better educated, more flexible workforce. Which again the burden falls on the Federal and state governments to bolster the education system. There aren’t two ways about it, tax rates need to be increased in the United States. Of tax rates in general, individual tax rates need to be increased on a disproportionate scale to corporate tax rates, which need to be decreased to become more competitive on a globalized stage. This is a tall order for even the most agile, and well-versed politician, damn near impossible for someone relying on on-the-job-training. On the other hand, maybe this is the one time in American political history that the motives of a self-serving businessman align with what is best for the country. After-all, despite being the richest person to every run for President of the United States, Donald Trump managed to be most relatable to some of the poorer parts of American society. Good luck Mr. President.

Tuesday, April 11, 2017

New Equilibria


It's spring time and all the usual signs are there. The weather, the people, the animals, but somehow this year feels different. The efforts of previous years simply just do not yield as much as they once did, and that's OK. This does not signify a need for retrenchment, but rather a need for exploration and evolution. The way forward, should always be forward. Globally, financial economics and the markets it studies are in a state of uncertainty, and again, that's OK. This is a time for new equilibria to be achieved, and in the process, there will inevitably be winners and there will be losers. The social responsibility of any organized economic area is to further the wellbeing of its inhabitants, this can especially be said for the afore mentioned losers. In the current environment, long standing trends are becoming more ambiguous, and this should be viewed as an opportunity. The opportunity is finding intrinsic value within the cluttered noise of markets, and market prices.

Monday, March 13, 2017

EUR/USD spot trade ahead of Wednesday's (03/15/17) Fed Decision

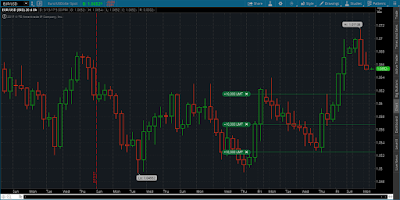
This is a short EURUSD position I opened ahead of the Fed Rate decision on Wednesday. I'm short 3 mini lots and my profit limits are represented in the chart.


Good luck.


Monday, February 27, 2017

US Dollar Trade for March 2017 (Maybe Longer)

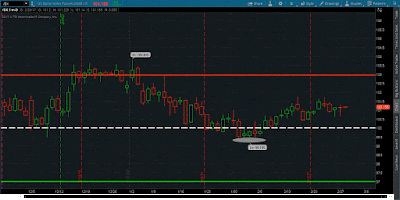
As an update to the February 2017 US dollar trade (maybe longer), I have expanded on the chart. The past month trading currencies has not been as consistent as the previous couple of months. My trading has been froth with conflicting feedback and false signals from my charts, and further hindered by the rigidity of my choice in trading approaches for this particular market environment.


I have highlighted (with the silver disc) the level I recommended selling the US dollar in my last post. The subsequent price action was higher, invalidating the trade, but not the trade idea.

From current level I recommend buying the US dollar with an exit target of 103 on the index. From there I expect the price to retrace back to the 100 level (highlighted by the dashed line), and then on to the 97 level on the index. At the 97 level on the dollar index, I expect the price to consolidate before moving higher back to the 100 level on the index and then on to the 103 level.

As it currently stands, there appears to be a +/- 3.00 point band around the 100 level on the US dollar index. This represents the range of uncertainty market participants anticipate about the future trajectory of the US dollar versus the currencies of its major trading partners. Good luck.


Tuesday, January 31, 2017

US Dollar Trade for February 2017 (Maybe Longer)

I have been long the dollar for the past several months, and it has been a trade. On the way up, I used the 100 level on the dollar index as both a target level for the initial run-up, and as a support level for the second leg of the trade.

Well its official folks, I'm calling the (temporary) end to the long dollar trade. I say temporary because there are some longer-term macro fundamentals that are at work, that will over time provide support to the US dollar versus its major trade counterparts. But for now, it seems that the most influential factor in determining the direction of the US dollar, and by extent the world economy is Donald Trump.


My trade idea is to short the US dollar from current levels, with a target of 97.0 for the index. From that level I expect sideways movement in the dollar with a relatively wide range. Representing a band of uncertainty outside of which a clear direction can be discerned. Good luck.