Translate

Sunday, July 19, 2015

Summer 2015 Part One: Long Dollar


I’m sitting in a long US dollar currency play against the New Zealand dollar that I must admit has been very good to me of recent. The position is one that I’ve been leaning against whenever I saw any short-term (intraday) inclinations of the dollar appreciating. Well more and more, over the past few weeks, I’ve been finding less and less short US dollar trades in my usual hunting grounds against the Australian dollar, the Euro, and the Pound Sterling. It was to the point that I had to start re-evaluating my short- bias stance on the US dollar. I started my search for fractal patterns that clearly repeated themselves in my shorter-timed charts, and the corresponding nascent stages of those same patterns in my longer-timed charts. At the same time I start parsing through the news headlines as the data statistics roll out for signs of an overall change in the sentiment of the numbers. As of now, (backward looking) economic statistics are still showing ‘slow and steady’ progress with US economic growth, and by extent, the rest of the world. 

The dollar has had a fairly extended period of steady gains against most major trade partners. This has been supported by the air of uncertainty that has lingered over the global economy since the recovery began back in late 2009. Most recently, I have stepped forward and called for a reversal of the dollar’s upward trend. This idea was being supported by the relative improvement in US economic data versus that of most trade counterparts, and the implications the Federal Reserve were telegraphing for monetary policy. The most recent development in the narrative is the perceived influence that financial market risk, global economic sentiment ex-US, and international institutions like the International Monetary Fund have over US monetary policy. This latest layer of complexity suggests that there are more elements of uncertainty in global financial considerations, and so more reason for investors to proceed with caution.

The investment portfolio implication is renewed support for a long US dollar bias. Not necessarily because of American economic outperformance, but because the US dollar is a relatively safe asset to hold over time. The same can be said for most other safe haven assets like the Japanese Yen and the Swiss Franc. The exception being gold; as inflation expectations remain well anchored in the US and across most of the developed world, and because it behaves more like a commodity rather than a hedge for financial uncertainty at this juncture. Equities should benefit in the medium term as easy monetary policy at most major central banks continue to depress interest rates, and by virtue the rates at which future cash flows of companies are discounted by to generate current stock prices.

Monday, June 22, 2015

I was right (this time)

If  you went short dollar when I said to go short dollar, then you would have made money. If not you didn't. Keep reading, keep trading, keep making money.

Thursday, June 4, 2015

The Tale of the Output Gap

The output gap, is a seldom mentioned economic statistic compared to some more readily recognizable ones like Gross Domestic Product (GDP) or Consumer Price Index (CPI), yet its implications have just as much sway over monetary policy as its better-known cohorts.

The output gap is defined as the difference between the actual output measured in GDP, and the potential output of the economy at full employment without evidence of inflationary pressure. A positive output gap refers to a period where the economy is producing above its long-term potential, and positive inflationary pressure is evident in the economy. A negative output gap refers to a period in which the economy is producing below its long-term potential, and negative inflationary pressure is evident in the economy. The Great Recession, was not the first period in American economic history where the output gap was negative, though it does stand out for its duration compared to other recessions. When it’s all said and done, the US output gap is likely to drift back into positive territory to offset the current period of a negative gap. I am interested more specifically in the overall trend unfolding in the time series of the output gap statistic.


After a short glance at the time series going back to 1949 of Output Gap data, a downward trend becomes apparent. My intuitive conclusion is that the American economy has been progressively falling behind its long-term potential for output, over the past 65+ years. This timeline coincides with the lifecycle of the Baby Boomer generation. In other words, the Industrial Revolution that occurred in the US economy leading up to the Great Depression, set the bar so high for relative expansion of production potential, that the following generation spent the sum of its working years perniciously falling short on the whole. Not to be understated, this is the generation that built on decades of industrialization to create what we now consider the difference between developed and developing economies. As a final act, the Baby Boomer generation facilitated the transition from the manufacturing centric economies of their boom years, to the service centric economies the developed world enjoys today.

The next Act is set to be as spectacular as, if not more so than, the previous Acts of the Industrial Revolution and the post World War 2 manufacturing boom seen in the developed world. The next Act is the story of the Millenials and a service driven economy that does not place a premium on labor. The x-factor in this part of the narrative is how integrated and extensive the role of technology will be in the resounding success, or epic failure of the next generation to ‘have a turn’. To the credit of the Millenials, technology is an incumbent part of their everyday existence, and integration of ideas both abstract and mundane, is second nature. The frontier of human-technology interfacing may prove to be ground upon which this next generation of entrepreneurs and problem solvers cultivates the next burst of economic expansion.


Thursday, May 21, 2015

All Good Things Must Come to an End


I’ve based most, if not all of my investment decisions around the performance and perceived outlook of the US dollar. It has certainly been a fairly consistent marker of global risk appetite versus risk aversion for as far back as I can compare financial data with the macro-economic narrative of the day. I have recently completed a full turnaround of my foreign exchange portfolio from net long dollar to net short dollar. The trading decision to turn the portfolio around was based on technical signals from my charting software, and the analysis it allows me to perform of the prices of my preferred securities. The conviction to initiate and follow through with the reversal comes from a compilation of my interpretation of my trading signals, and the evolving macro-economic environment.

My technical analysis of the price movements of a few dollar exchange rates have highlighted several consistencies with some trading signals and the directional magnitude of the market outcome of macroeconomic data and information. Though the individual currencies in the portfolio paint their own pictures of their respective economies on the ground relative to the dollar, the index acts like a weighted average for comparison. This average represents the sum of all greed and fear in international capital markets. In a nutshell, as of recently, the signals that I have been interpreting from my technical analysis have all been pointing to international capital markets that are finding fewer and fewer reasons to be fearful of the near-term macroeconomic environment. With this easing of sentiment, the dollar will lose its allure as a safe-haven in exchange for rising foreign yields.

The picture painted by my technical analysis of my charts tends to coincide with the macroeconomic narrative that the Federal Reserve and most market commentators seem to subscribe to. It is worth mentioning that as before, the mistiming of a macroeconomic insight and a financial market decision making has left me needing to actively manage my hedging efforts while I wait for the rest of the party goers to realize the festivities are over.

Tuesday, May 5, 2015

While We Wait

The US dollar is accepted practically everywhere, and is used more than any other currency for international transactions. The US economy by most measures is still the largest and most productive economy on earth. This puts the United States in an interesting position; some might say dilemma.

When the US economy was growing at its potential and the dollar was falling, a large portion of exports generated in emerging and developing markets were either meant to be sold in the US, or processed elsewhere before being sold in the US. Inversely, those same exporters were the ones consuming the technology and intellectual property being exported by the United States. But as it currently stands, the US economy is rehabilitating from the traumatic effects of the 2008 Global Financial Crisis and resulting economic spillover. Meanwhile the dollar has been rising almost vertically for the last five years or so. This recent trend in the dollar translates to a general level of unease - - not necessarily fear - - in international financial markets. US economic data have been overall positive and improving. But with the demographic shifts that are beginning to accelerate in developed economies, along with already monumental levels of private and public debt, sources and drivers of sustainable growth are few and far between. That being said, historically the safest place has been the US dollar in times of economic uncertainty.

The current consensus is that this summer, conditions will be ideal for the Federal Reserve to begin re-adjusting its stance on loose monetary policy. This will undoubtedly be a significant signal from the Fed to US and global financial markets that the economy is once again growing on a sustainable path that can lead to a zero output gap. This signal will inevitably filter into foreign money markets and interest rates will adjust in other economies closely linked to the US. Once local prices adjust, in response to inherent sensitivity to funding costs, monetary policy in other major economies will begin to re-align as well. This scenario plays out if the signal from the Fed is reinforced by subsequent steps towards further policy tightening. This of course, can only happen if the US economy is once again growing on a sustainable path that can lead to a zero output gap.

In the meantime the dollar is beginning to consolidate, and somewhere out there, investors are positioning their portfolios for long anticipated news from the Fed on how the US economy is really doing via monetary policy signals. The Fed, in turn is waiting on signals in the economic data to discern the future of monetary policy; and in the real world, people go about their daily lives.

Monday, April 20, 2015

Not Quite Like Before: The Dollar and the US Economy at Odds


 The dollar is currently rising through levels not seen since the mid to late 1990s. That of course was a time of great optimism, inspired by a wave of economic development and expansion, not just in the US but across the globe as a whole. Since then we’ve seen the dollar peak and drop to lows made just prior to the onset of the Global Financial Crisis of 2008. Along the way, the tech bubble burst, the housing bubble burst, and finally the commodity bubble burst. The bubbles themselves representing the peak of the dollar, the accelerated decline, and reversal respectively over time. Now, the dollar is once again appreciating steadily versus the currencies of US trading partners.

On the surface, this looks like the US economy is standing out as a place where an investor can earn a reasonable return when adjusted for risk, as was possible in the late 1990s. With a few details missing this time of course. For starters, the economy is just not growing with the same enthusiasm as it did back then. Unemployment is not providing upward support for wages and consumption now as it did in the 1990s, while short and medium term inflation in not expanding providing support for interest rates and monetary. This much being obvious, the financial markets have been able to steady the course to higher prices for both stocks and bonds. Albeit, a sizable chunk of the financial asset price increases can be attributed to the mechanical requirements of administering the Federal Reserve’s Quantitative Easing programs by the Federal Open Market Committee (FOMC), the remainder can be attributed to investors underpricing risks of future price decreases by continuing to transact at the elevated price levels.

As with most aspects of human existence, this too is unsustainable. The complexity of the moving parts that influence the macroeconomic, and monetary equilibrium of an economy like that of the United States will undoubtedly continue to make deciphering a clear narrative a daunting task.

Wednesday, April 8, 2015

What Really Happens to Asset Prices?

If you subscribe to the conventional dialog about the normalization of monetary policy by the Federal Reserve, the so-called ‘lift-off’ should be this summer or thereabouts. I’m not necessarily convinced that the timing is best, but I digress. The primary result of the Quantitative Easing programs utilized by the Federal Reserve was an enormous increase in excess reserves in the banking system. A secondary effect was the run-up in financial asset prices, as a result of the open market actions of the Fed to influence the levels of long-term interest rates. Economic Commentaries from the Federal Reserve Bank of Cleveland suggest that the target of Fed tightening will be the excess reserves within the banking system, and not necessarily interest rates from the onset.

When the vast amounts of liquidity that the banks hold starts to collectively dry up due to the change in the Federal Reserve’s stance on monetary policy, the transactions that have been supporting financial asset prices will begin to slow. At that point, what happens to asset prices? Equities prices on one hand, are at record highs and likely to drift higher. Without the technical demand from the banking system, the fundamental demand in relation to household savings levels will not be enough to keep equity prices at or above current levels.  Debt prices on the other hand, are at record highs and likely to drift higher. It is important to note, that the rebalancing effects of the Federal Open Market Committee’s (FOMC) actions in the debt markets to influence long-term interest rates pushed bond prices to now elevated levels.

Quantitative Easing was a necessary evil on the part of the Federal Reserve, as doing nothing would have been even less palatable. Now, we’ve arrived to the point of dealing with the aftermath and eventual unwinding of the policies. Without the implicit and at some points explicit support of the Federal Reserve, financial markets in the US and by extension the rest of the world would be forced to stop pretending. A more realistic picture of the economy may have a chance of emerging. Monetary policy unwinding does not necessarily turn into a market crash, it would simply effect a realignment of Wall Street with Main Street.

Wednesday, March 18, 2015

Why Spend When You Can Save?

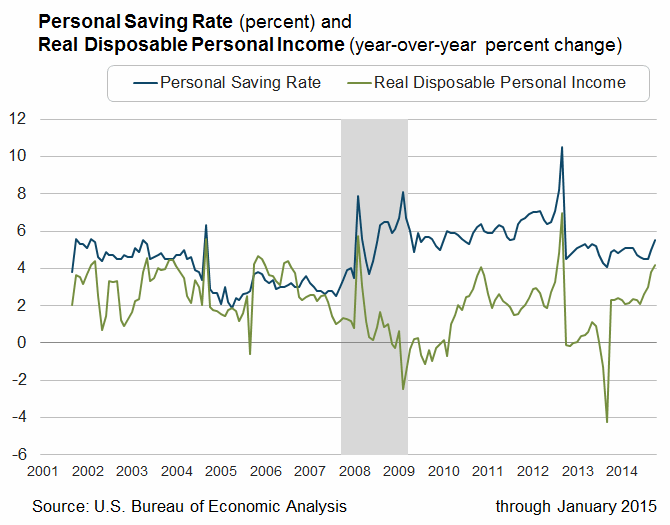
According to the most recent measure of Personal Saving Rate and Real Disposable Personal Income by the U.S. Bureau of Economic Analysis, both the Personal Saving Rate and Real Disposable Income have been trending higher in recent months. This by itself is wonderful news and should be reason for optimism. But alas, in the world of macroeconomics things are [almost] never that simple. Increases in the Saving Rate should be followed by increases in investment and consumption, though the same can be said for increases in debt. The investment side of things is underway insofar as financial markets are liquid and risk is cheap, thanks to the co-ordinated efforts of Central banks around the world. The tangible side of investment still remains elusive, as fiscal leadership no-doubt has to play a pivotal role in making those dreams a reality.


The measure preferred by the Fed for tracking inflation, The Personal Consumption Expenditures Price Index, which is also compiled by the U.S. Bureau of Economic Analysis, is already below the Federal Open Market Committee’s (FOMC) explicit objective.  The Index has been extending its trend lower in recent months. The headline measure [which includes oil] is far lower of course than the core measure which is meant to be more stable over time. The core measure is also falling, which indicates that some of the downward pressure on consumer prices is already baked into our ‘economic cake’. The irony of the situation is that what is playing out among households across the United States was first demonstrated by the commercial banks with new Fed money; they saved or deleveraged, and would only spend on investments that were high priority.


After all, the American consumer has not received a real raise in quite some time, so it would be somewhat difficult to save and consume at the same time especially since job confidence took a huge hit with the 2008-2009 recession. It is also generally agreed that American debt (both households and government) was reaching unsustainable levels leading up the Great Recession. The Fed helped the banks, the Federal Government didn’t do much, and now households are finishing the job of the public sector. Americans will continue to save until the collective urge for gratification becomes overwhelming, and then the savings accounts, retirement accounts, home equity, credits cards, and student loan money will be unleashed unto the global economy again. And of course, the banks will be there with a new and improved list of financial instruments that are guaranteed to make the world a better place.


Monday, March 2, 2015

Political Rhetoric Meets Real World Economics


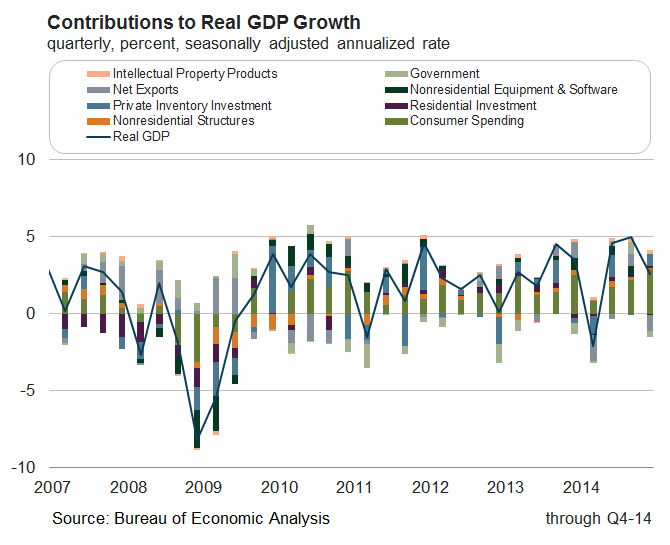
Its not very often that one gets what one wants in life, and politics is by far no exception. A strong dollar looks and sounds good from a strategic and rhetorical standpoint, but in real terms the outcomes are not always so romantic. Looking at contributions to real Gross Domestic Product (GDP) growth, which is an economic indicator compiled by the Bureau of Economic Analysis (BEA), two components stand out as having a negative impact on Real GDP growth on a quarter-on-quarter basis. Both net exports and government [spending] are down. First, net exports are down as result of an appreciating dollar that has been making domestic goods and services more expensive relative to foreign equivalents. Second, government spending is self-explanatory, as it simply spends less.


These ideologies are appealing on paper and in speeches, but in the real world they leave the US with a losing hand in globalized trade. US investors also lose the net gain from repatriating returns on foreign denominated investments that occurs when cheaper dollars bought back than were sold at the time of the initial investment. Cuts in government spending that free up productive capacity that the market cannot fill tends to cause the price of marginal units of productive capacity to fall; we see this overall effect in Real GDP, wages, and inflation expectations. There’s a time and a place for everything – or so it is said – and the US economy is the place where a globally- traded currency can appreciate with little detriment vis-a´-vis its peers. The time however, is not favorable for fiscal policies that increase rather than decrease excess productive capacity in the US economy. At least not in conjunction with the tightening monetary policy aspirations of the Federal Reserve System.

Wednesday, February 18, 2015

Who's Buying?


For all the not-so-good economic news that is streaming out of most developed, and some developing economies, the news out of the US is interestingly upbeat. The same economy that just lead the world into and out of a Global Financial Crisis, is now the measure of growth amoung its peers. Inflation is below the Fed’s long-term target, and the unemployment rate is within range of what is considered full employment. In addition, the Federal government can borrow for long periods at relatively low rates, and stock market indexes are at record highs. But looking closer, there appears to be several details of this rosey picture that do not align with the overall sentiment.  


Retail Sales is an interesting starting  point. Since 2011, the year-over rate of growth in Retail Sales [in both the broad and adjusted sence] has been slowing. This trend represents a period of restraint on the part of the US consumer, typically seen leading up to a recession as illustrated by U.S. Census Bureau data. The outcome of this slowdown in retail sales growth may not necessarily be an outright recession because most measures of consumer sentiment are at levels not seen since the run-up to the 2008 – 2009 recession. What this slowdown, in retail sales, may be signaling is an overshoot from the momentum of the recovery to a level above the a new [lower] equilibrium, and its inevitable correction. All the same, a lower equilibrium level for retail sales growth would ultimately mean  subdued demand behind consumer spending. However, this does not lineup with the strong growth picture being painted by the labor market and other measures of economic progress.

Sunday, February 1, 2015

The QE Effect: US vs EU

Whether faced with deflation, or economic malaise, or recession, central banks around the world are turning to Quantitative Easing (QE) to solve issues to which normal monetary policy would otherwise be the solution. The most recent to embark on the journey down the rabbit hole is the European Central Bank (ECB). However, due to structural differences in how the financial system intertwines with households and corporations in the US vis-a-vis the EU, the outcomes of similar monetary policy approaches will be inherently different.

In the US, corporations tend to tap the financial markets directly for funding via debt and equity issuances, which allow them more direct access to and benefit from new money created by the Federal Reserve. In the European Union (EU), on the other hand, corporations tend to tap the banking system for funding, which in-turn taps the financial markets. That additional step lets the banks in the EU play an even greater role in transmitting monetary policy into the real economy. In the US, the inflationary effects of QE were nullified by the banks, as the new money created by the Fed never left the Fed. The banks simply held the new money from the Fed on deposit at the Fed, and continue to collect the interest on it. Capital that wasn't held as reserves was invested in short-term market securities and equities. The Federal Open Market Committee (FOMC) is not agile enough to calm jittery financial markets and deal with run-away inflation simultaneously, so it worked out in their favor that the only price increases were in the financial markets, which are the beneficiaries of lowered funding costs.

If the banks in the EU do what banks around the developed world have done when new money is created and made available by their central banks, they will simply pad their balance sheets with cash and securities. This is fine if the issue is with the quality of assets held by the banks; but, when the issue is a lack of credit creation through loans, this is counterproductive.

European QE will amount to the ECB refinancing sovereign debt across the continent via the commercial banks, since banks can post government debt as collateral for cheap money from the central bank. Because of almost no opportunity cost due to a lack of inflation and current nominal interest rate levels, banks can invest in market securities whose prices will be supported by the ECB's QE policy. At this point consumer and business loans are not very appealing to the banks, as the viability of those loans is tied to underlying macro-economic performance, which has been lackluster of late. Instead, based on the design of the EU monetary transmission mechanism, this type of monetary policy could lead to a lowering of borrowing costs for banks and sovereigns and as a by-product, rising equity markets. The one thing that might be conspicuously absent is inflation; with QE from most other central banks, monetary policy at the zero lower-bound is very inefficient at generating inflation as wages remain outside of the sphere of influence.

Thursday, January 15, 2015

Commodities Lead and the Dollar Follows

The US dollar (in broad trade-terms) has been acting weird lately, and by lately I mean since early 2011. Going back to the turn of the millennium (15 years ago), the tech bubble burst and there was a lot of speculative money that found itself without a purpose. Going back even further, the US focal shift from manufacturing to tech-based services during the 1980s and 1990s, saw raw materials ignored for computer-based research, development, and production as an investment theme. Speculative investment capital flowed in particular out of commodities and commodity exporting currencies.

The 20-year trend officially reversed in 2002, aided by the Fed's easy monetary policy in response to the recession associated with the September 11th attach. The liquidity made available by the Federal Reserve system accomplished two things; the housing market inflated with speculative capital flows, and globalization-driven growth in emerging and developing markets attracted dollar denominated investment flows. As dollars got to their foreign destinations, they had to be sold to acquire local currency. The foreign-financed growth fueled new demand for raw materials, and supported commodity prices and commodity exporting currencies.


From 2002 through to 2008, commodity prices trended higher as the dollar trended lower, representing an expanding appetite for risk by international investors. Then the Global Financial Crisis hit, and the reflex reaction of investors around the world was to find safety at all costs. Almost all risk-assets saw a tumble in prices, as short-term US-government debt was bought en masse for its apparent safety and liquidity. Commodity prices, not to be excluded, also fell. Once the financial markets stabilized in 2009 with a monetary commitment from the Fed and other central banks, the trends seen in commodity prices and the dollar from 2002 resumed.

In April of 2011 (as reported by the Federal Reserve Bank of Atlanta), commodity prices peaked. At that point it was becoming clear to investors that the long-term trajectory of global growth was shifting lower, and the demand for raw materials would be depressed, at least for the immediate future. The Fed however, did not incorporate this view into monetary policy until later the following year, when they announced the third round of quantitative easing. This was viewed as final confirmation that slower global growth would hamper the US recovery, and by virtue, perpetuate slower global growth, and so the dollar once again started appreciating as commodity prices continued to slide.


The relationship between the US dollar and commodity prices has been, and continues to drive macro cycles in the global economy. From a fundamental basis, the dollar's appreciation is driven by uncertainty. As the customer of first and last resort, global economic strength and stability resides with the United States. Yet, the US depends just as much on its trading partners for growth as they do on the US. In this age of uncertainty, one thing is fairly certain; the global economy is underperforming its long-term potential. So while everyone waits for a new (lower) equilibrium to be reached, from which point the global growth outlook can improve, the US dollar will remain the safest bet.

Thursday, January 1, 2015

Infrastructure and Taxes: Who should have to pay?

According to the November 10th 2014 edition of the Federal Reserve Bank of San Francisco's Economic Letter, the Federal Open Market Committee (FOMC), the Congressional Budget Office (CBO), and Blue-Chip Forecasters have all been lowering their projections for long-term GDP growth following the Great Recession. The Economic Letter cites, "The aging of the labor force, weak productivity growth, and possible long-run supply-side damage from the Great Recession have all suggested recently that the potential growth rate of the US economy may be lower in the years ahead." At this point I digress from the subject content of the Economic Letter, as it proceeds to explain conclusions about the possible links between lower output growth and lower short-term real interest rates. I have decided instead, to focus on a few implications of lower potential growth on the looming infrastructure needs of the United States.


If it was not for the obvious question, how would the mammoth price of a full upgrade, and in some cases rethinking of the current infrastructure layout that exists, the failing US transportation and energy infrastructure would have already been replaced. Left up to the states, the cost would be covered from a patchwork increase in taxes. But, left up to the Federal government, the cost would be covered by borrowing vast amounts of money.


Letting the costs of upgrading the public infrastructure fall on the states would mean the total costs of the improvements must be squared away from the onset. Any given state would either find a way to raise the revenue, or collateralize debt with future tax revenues. This approach lets [for the most part] the people that utilize the infrastructure bare the bulk of the burden of financing it.  States will also have the opportunity to exploit, in some cases, regional disparities in customizing their revenue generating approaches. For the most part, the costs will be distributed in concentration with need and urgency.


The Federal government on the other hand will follow the path of least resistance, and borrow. The administration of federal infrastructure spending as it would be a monolithic project if done right, would also be a bureaucratic mess. Costs would become overblown, and inefficiency would be abound. Costs for the most part will be spread disproportionately evenly, as both Federal government borrowing or hopefully tax policy change will apply universally, instead of in concentration with need and urgency.


It doesn't really matter how you slice it, in order for a comprehensive upgrade of the US transportation and energy infrastructure to be undertaken by any level of government, tax revenues would need to be raised and/or spending levels reduced. This feat would be much easier to accomplish when the economy is growing and profit generating activities can be taxed. During growth and expansionary times, as the income prospects of households and individuals improve, higher taxes are more easily accommodated. Without the rising tide of accelerating growth to lift all boats, it is hard to see how government [especially at the federal level] would be able to sustainably fund large spending projects.


The states in this instance, seem to be better capable in terms of experience and fiscal constraints to administrate infrastructure upgrading and replacement spending. Wherever need and urgency are disproportionately high, the Federal government can use expansionary fiscal policy to subsidize funding. This approach allows for some fiscal restraint due to the structure of the state finance model, while the Federal government plays a smaller role as a funding backstop. The objective here being to upgrade the nation's energy and transportation infrastructure, while not exacerbating the already horrendous fiscal position of the Federal government.